Using Overwolf`s developers tools
The Overwolf developer toolkit is a set of web authoring and debugging tools.
You can use these tools for a variety of tasks, among them: Listing which assets the page has requested, how long each asset took to load, reviewing tools for currently-loaded HTML, CSS or JS, and more.
Chrome Developer Tools are disabled by default. The only way to enable them, is by adding a registry key. Read more here.
How can I access the Overwolf developer tools?
There are two ways to open the Overwolf developer tools:
1 - Using Hotkeys
- Run the app.
- Click on the app window that you want to debug.
- Press Ctrl+Shift+I.
Doing this will immediately open the development tools window for this app window. If it's not working (and you have just added the registry key) restart your machine and try again.
2 - Through the Overwolf settings
- Right click on the Overwolf tray icon.
- Select Settings → About tab → Development options.
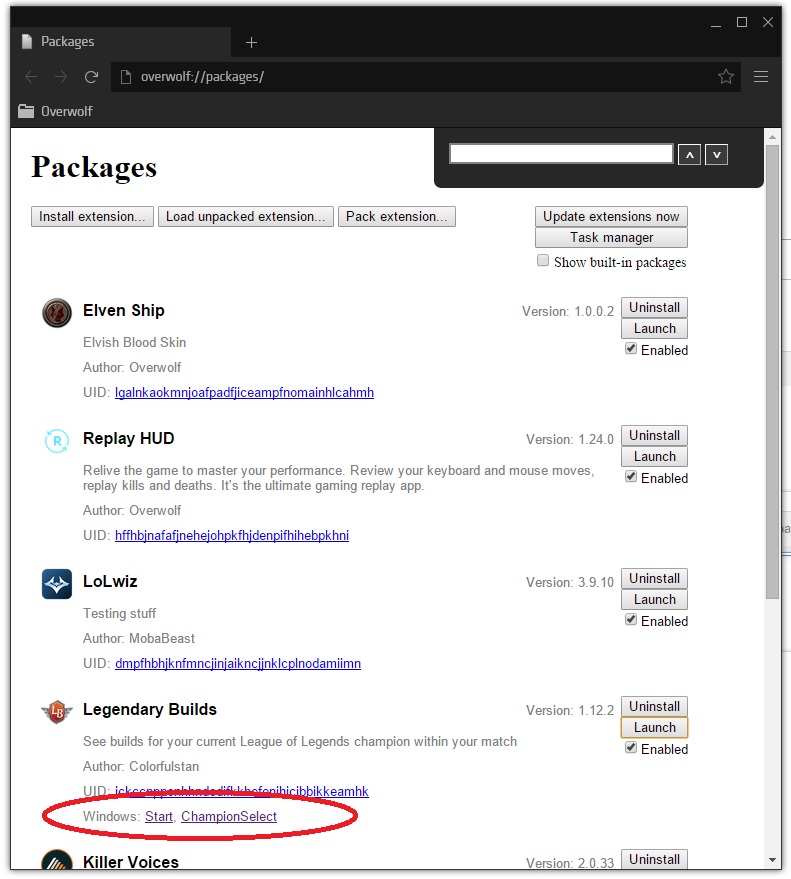
- Launch your app and select the relevant window's name in the Packages window.
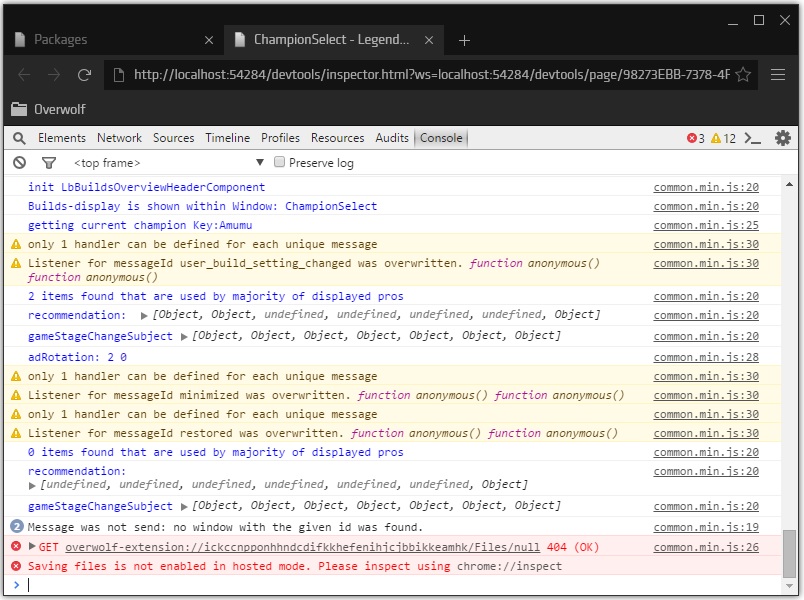
After launching an app, the names of all of the app's active windows will show up in the Packages window, under the app's entry. You can click on any window name to bring up its own instance of developer tools:
Explore each menu
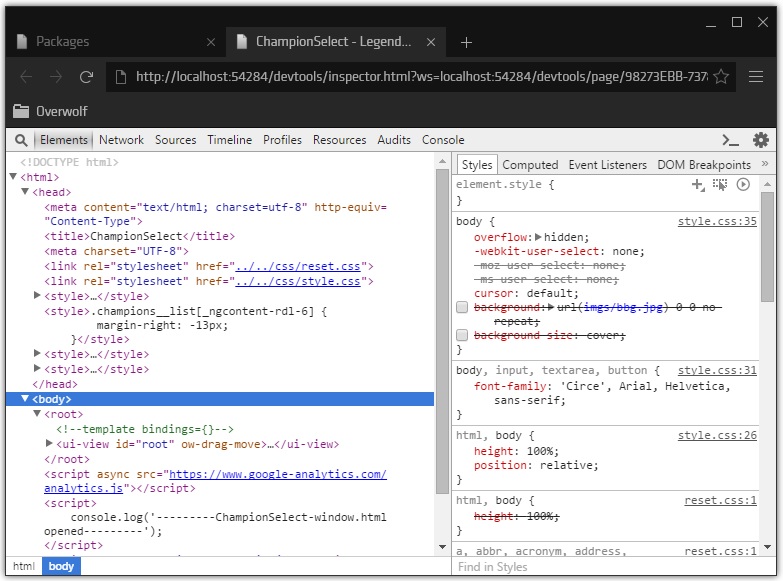
Elements
The Elements panel allows you to see your app window's HTML code during runtime, as well as the CSS styles applied to each element.
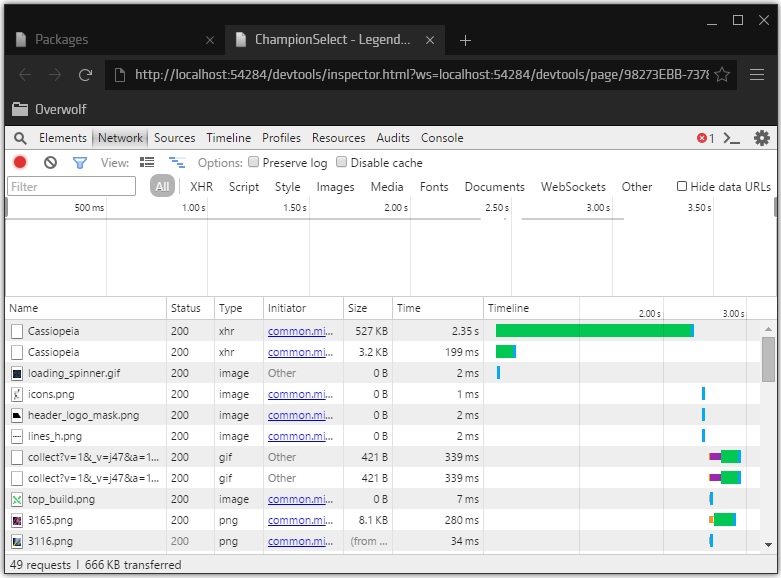
Network
The Network panel displays information about every network-related operation on a window. Use it to get insights into requests, downloaded resources, and opportunities to optimize the app's network performance.
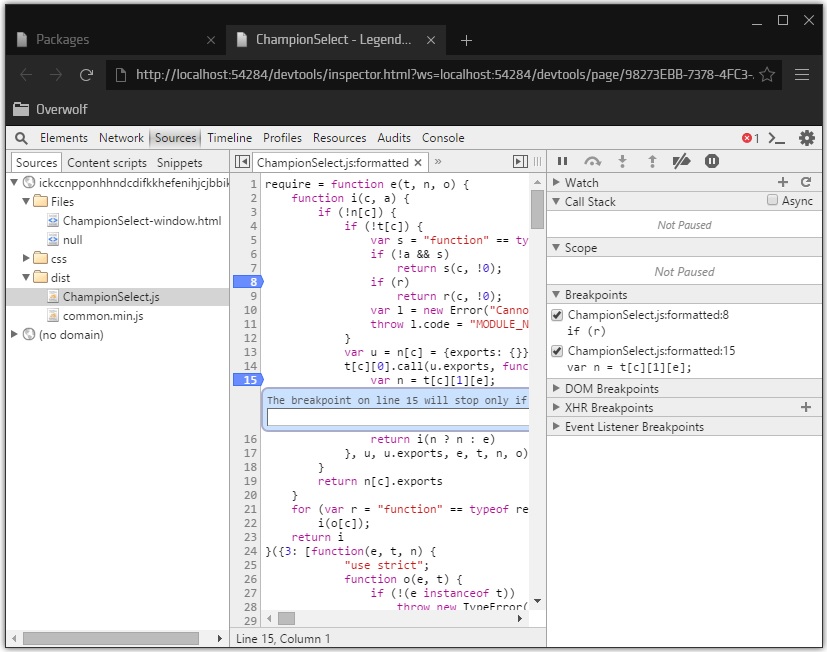
Sources
This menu enables breakpoint-based debugging for JavaScript. Breakpoints can be configured to only be triggered when specific or general conditions are met.
Tip – Make minified code easily readable by using the “pretty print” button (the { } button at the bottom left of the code area)
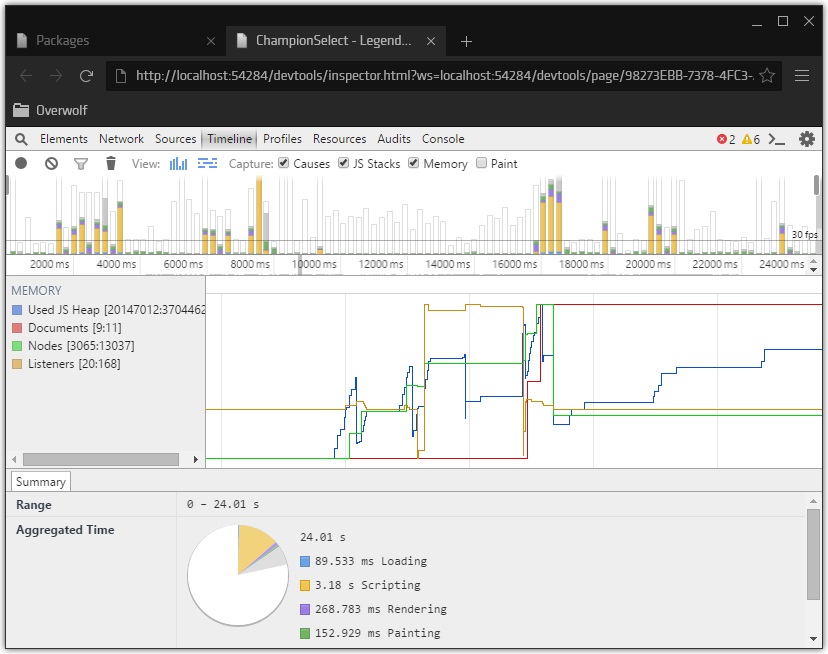
Timeline
The Timeline makes it easier to spot non-permanent or situational issues, and assists you in improving the performance of your app by inspecting events that happen during its usage timeline.
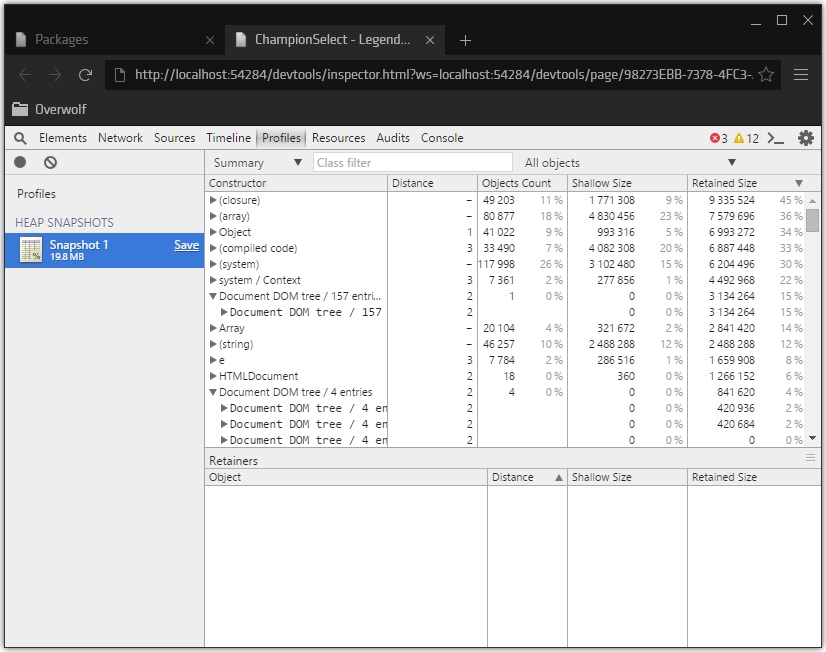
Profiles
Learn more about the memory usage and execution times of your app here. The CPU and Heap profilers help you find where resources are being spent, helping you make sure that your app is running as smoothly as possible.
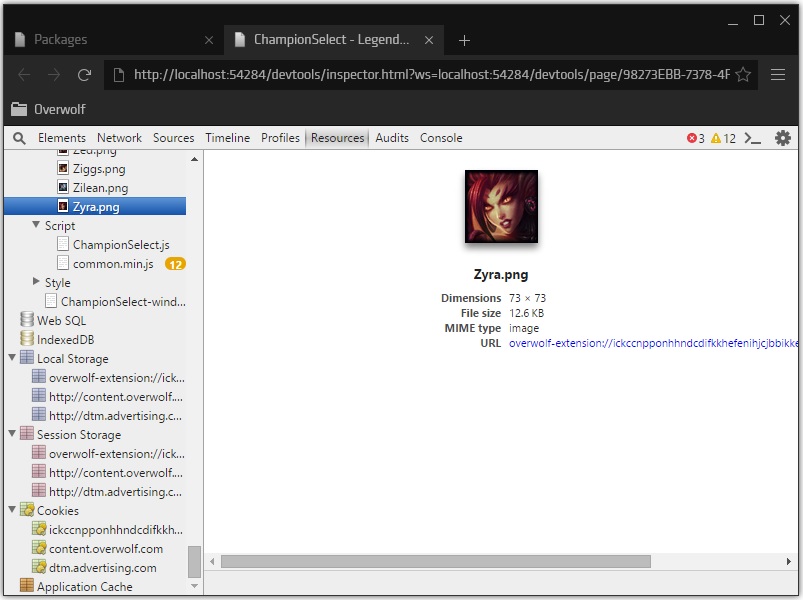
Resources
Review all of your app's loaded resources, including databases, session storage, app cache, cookies, fonts and more.
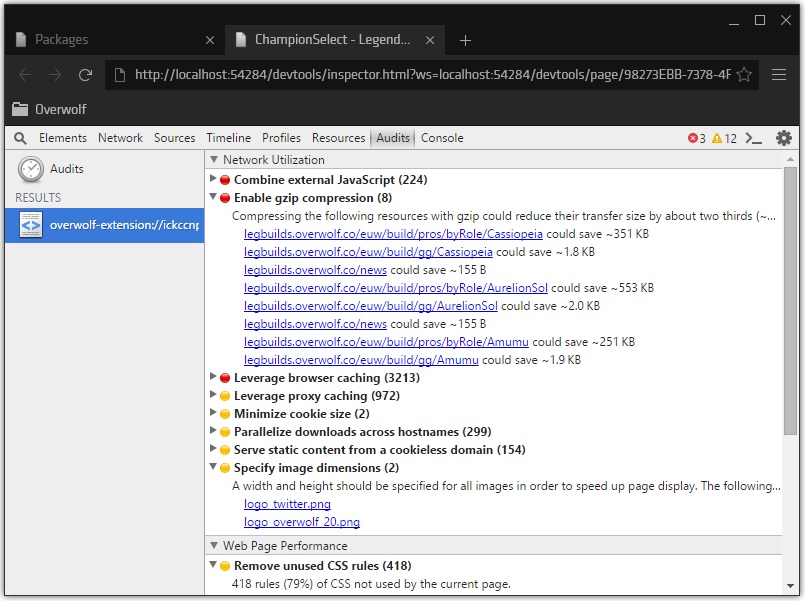
Audits
Audits analyze your app, suggesting ways for decreasing load times and increasing your app's responsiveness.
Console
Allows interaction with your code, as well as logging capabilities, to help you as you develop your application.
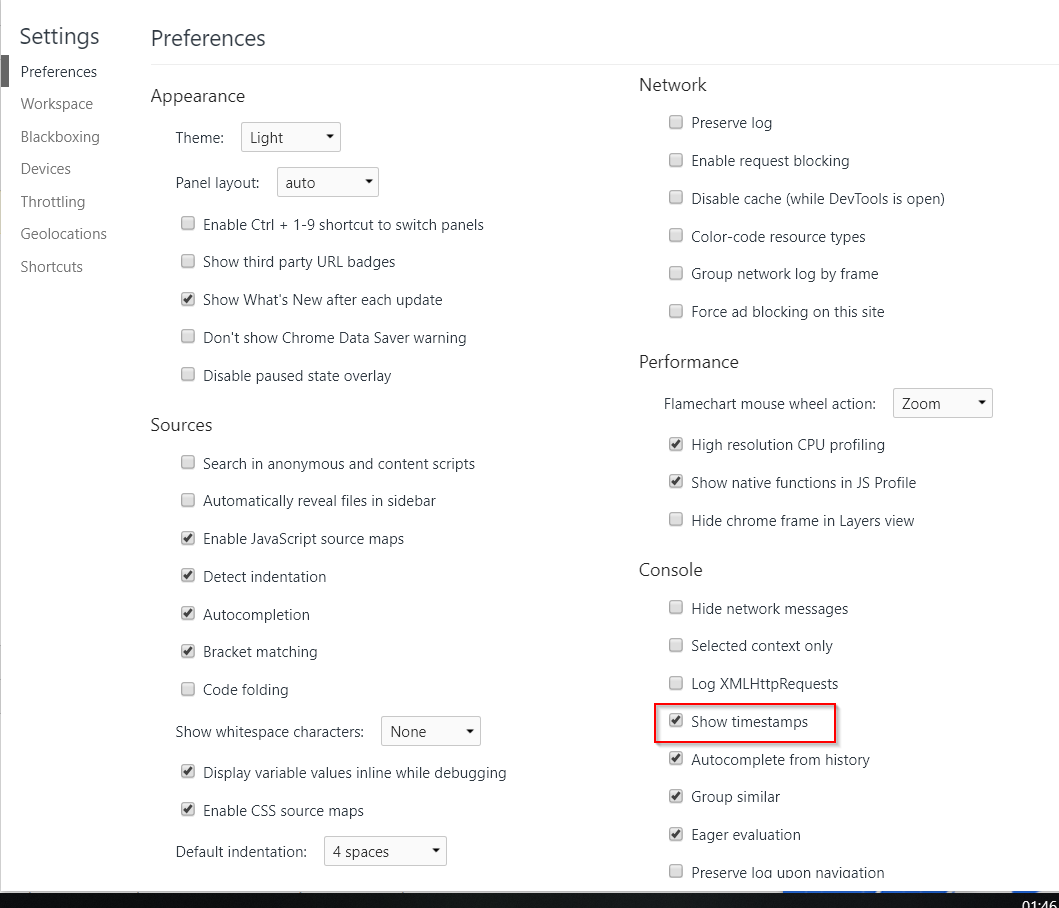
Enabling Time Stamps in Console
Sometimes it’s useful to see timestamps in your console when you are debugging. To enable this behaviour, go to the console settings (settings wheel in the top right), and select your preferred timestamps preferences:
Use the remote debugger
In addition to the developer tools debugger, you can use the regular chrome debugger.
The remote debugger has two advantages:
Easier to use in a secondary monitor. In some cases, like when debugging in-game windows, it's more convenient to open the debugger on a different screen, and not as an in-game Overlay that can hide the UI.
Eliminate overwolf-debugger related issues.
In some hard to crack cases, it might help to open another debugger that might display the data differently.How to use the remote debugger
Make sure your OW app is running.
Open a new chrome browser tab.
Open this URL: http://localhost:54284
You can see the list of all open OW apps and windows. In this example, you can see a couple of Facecheck app's windows, along with our rocket league sample app, an ads window, and more:
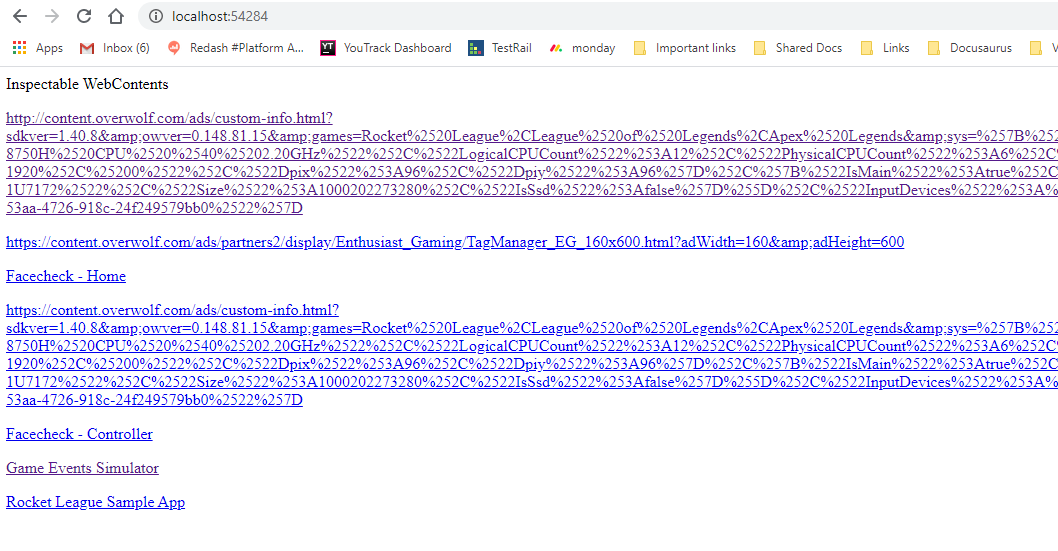
Clicking on a link will open a remote debugger tab.
Use local debugger with debug_url flag
For local-server debugging (like with react apps) you can use the debug_url flag in the manifest file.
Enabling automation testing with automation flag
It is possible to use a testing framework (e.g. Selenium) with your application. More details here.
Run your React app locally
Runs on a node.js server.
- Download a react project (E.g. This one).
- Extract it into a folder and open it in VS Code.
- Run the project using npm -i inside VS Code.
For this example, we assume that your react app is running on localhost:3000.
Debug your OW app window locally
For this example, we assume that your app has two windows: a background controller called "main" and an app window called "popup".
- In your app's manifest, add the debug_url flag on the same port as your react app (3000):
"popup": { "file": "popup.html","debug_url": "http://localhost:3000" }
- Load your OW app as an unpacked extension.
- Open the CEF remote debugging URL in chrome (http://localhost:54284).
- Find the "main" app window on the list, and open it. The dev console will open for this window.
- Open the "popup" window by typing into the console:
overwolf.windows.obtainDeclaredWindow('popup', console.log)
overwolf.windows.restore('popup', console.log)
The popup window will open, and your react app will load up inside of it.
Now every change that you'll perform in the react code will reflect in the OW window.
Notes
- You must have a local web server installed on your machine.
- This only works when loading unpacked extensions.
- This only works when connecting directly to "localhost" / "127.0.0.1".
- When using debug_url, calling
overwolf.windows.getMainWindow()produces a known issue, and it will not work as expected: it returns a reference to the current window instead of the main window.